PILOT SERVICE
Custom Excel management dashboards
See the measures that matter without rebuilding the report every month.
We design decision-focused Excel dashboards around your data, KPIs, reporting cycle and management questions. A simple executive view is supported by traceable analysis, editable native charts, controlled calculations and detail for professional review.
INTERACTIVE MANAGEMENT DASHBOARD
See complex operational data become a clearer management view.
This short demonstration shows how a tailored Excel dashboard can combine an executive overview, filters, trend analysis and a bilingual presentation. The final structure, measures and decision views are designed around each client’s real data and management needs.
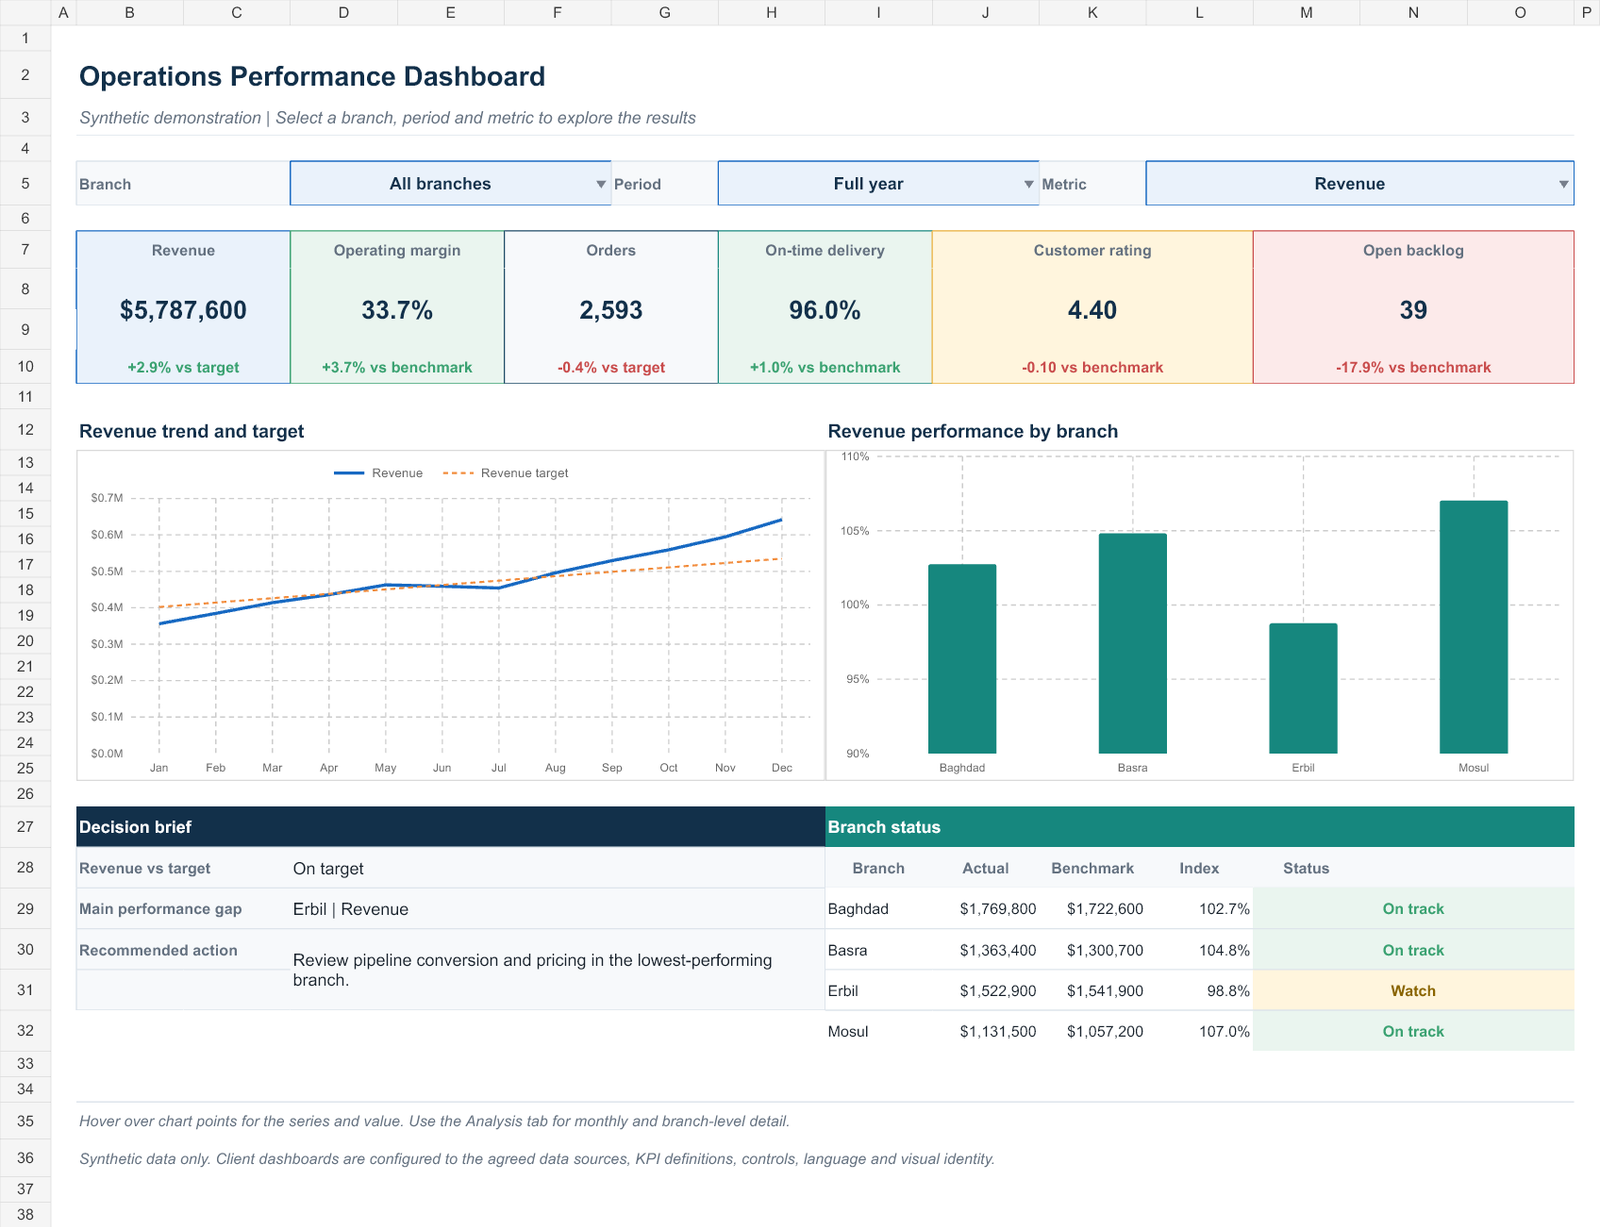
A static preview is available in place of video playback.
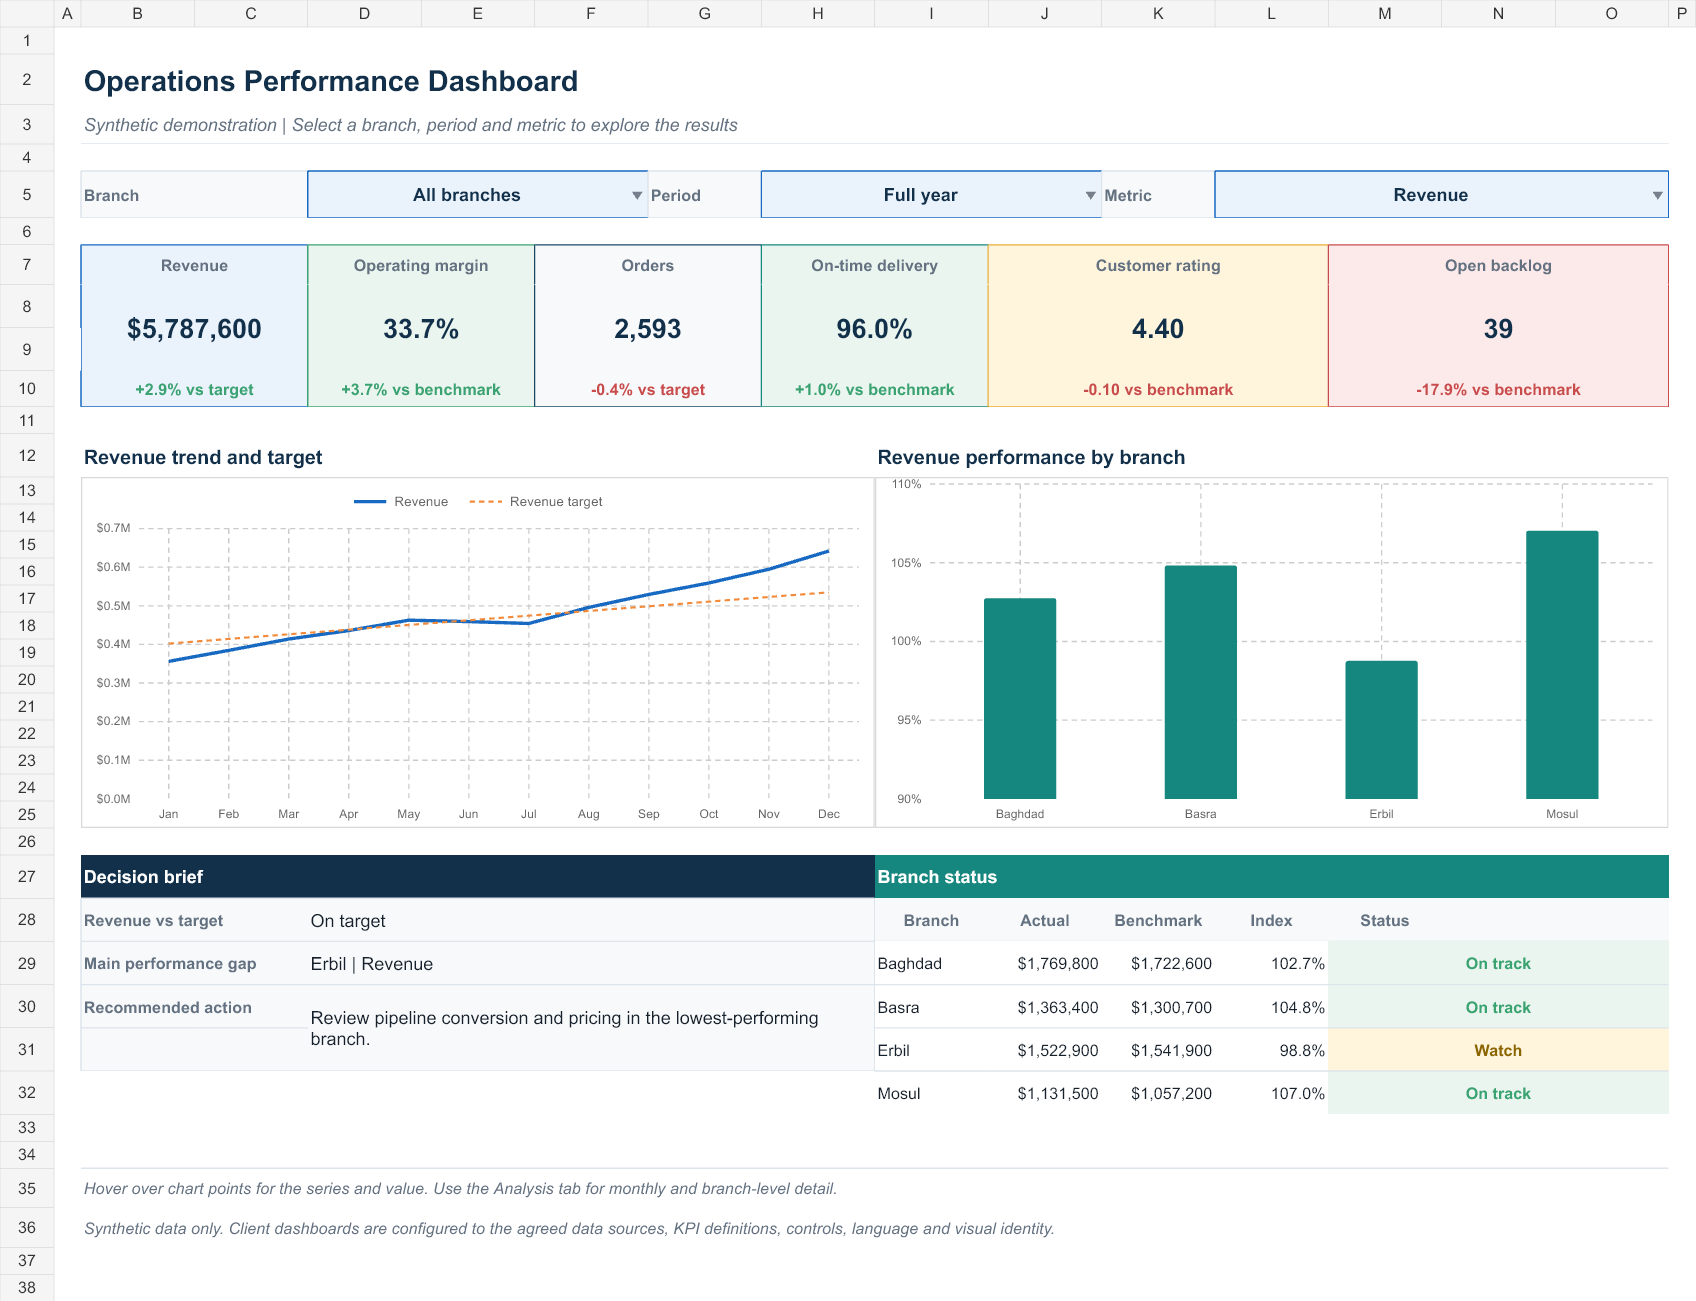
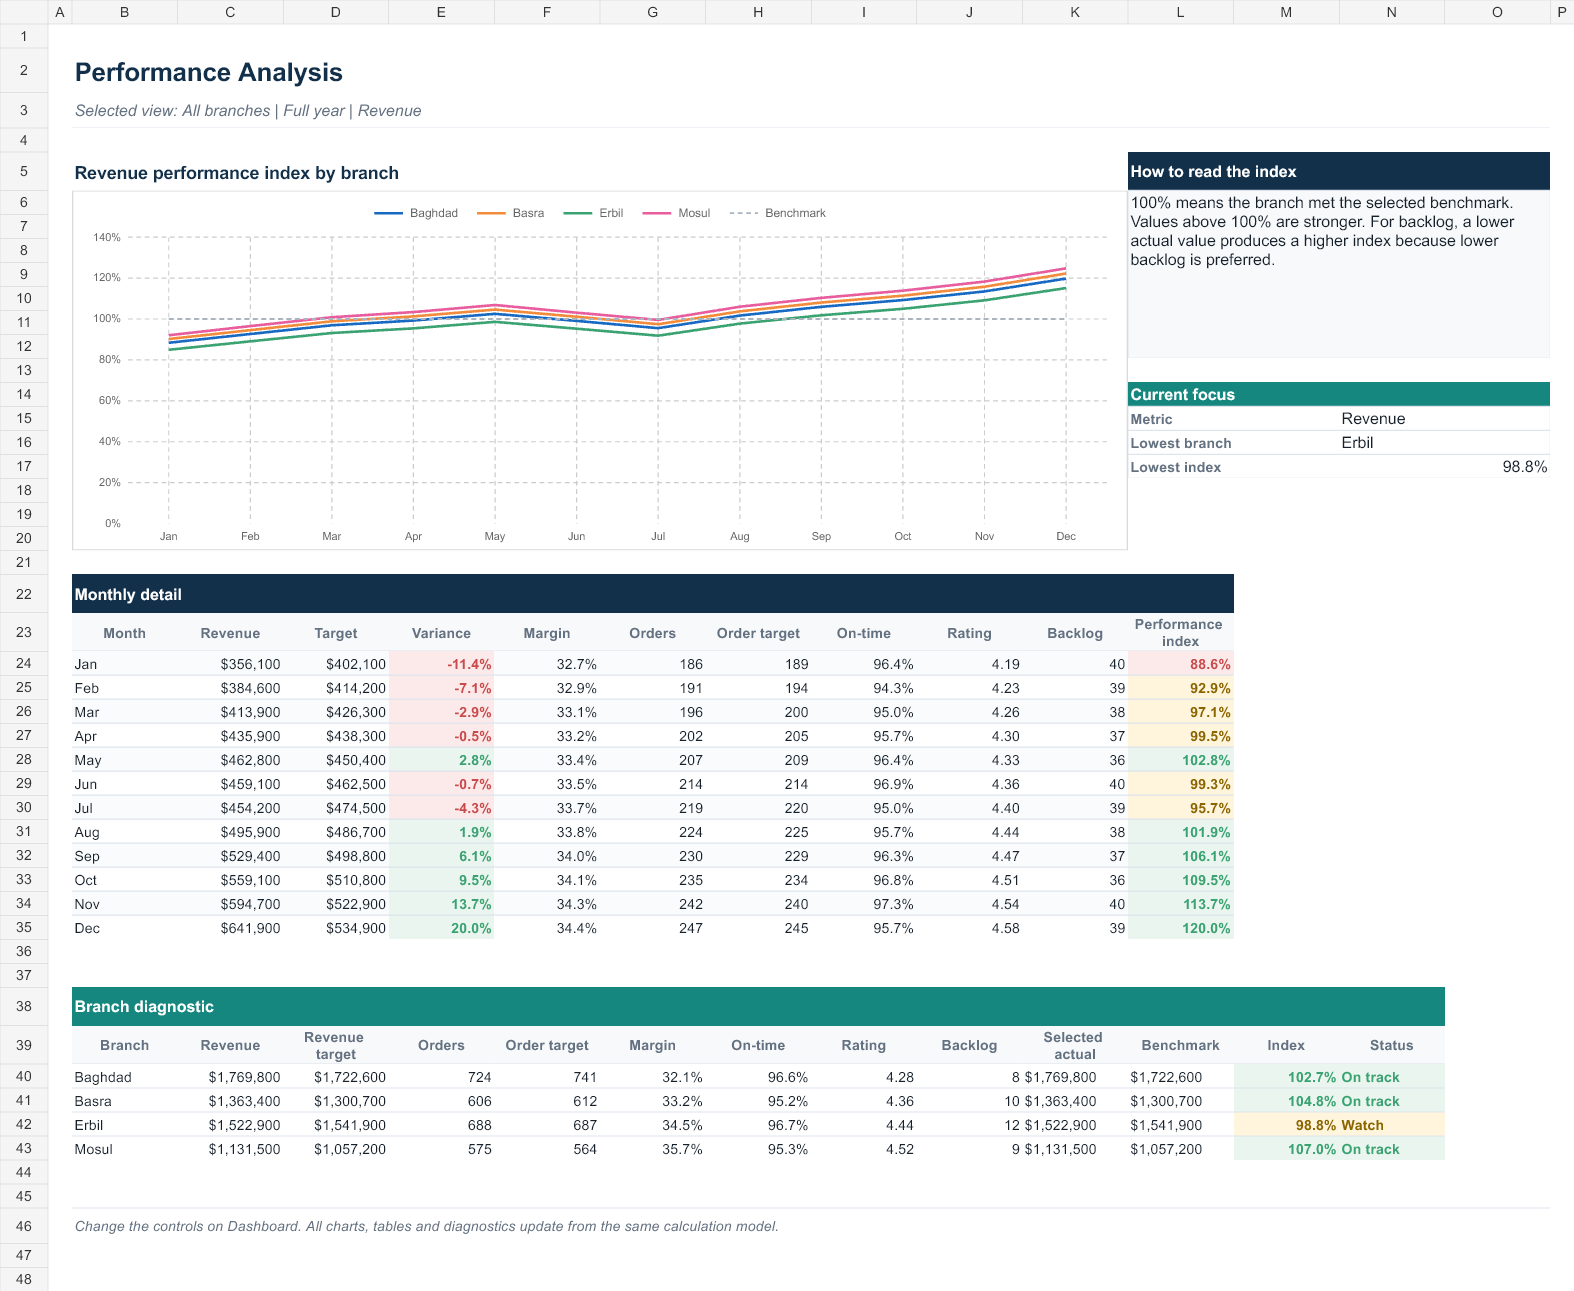
A quick management view with analytical depth
The website images are static previews. The delivered workbook can include native Excel controls, editable line charts, filters, KPI calculations and traceable source data configured to the client’s needs.
Select an image to open the full view and zoom.
What can be included
- five to eight priority KPIs in a bounded pilot;
- monthly trends and target comparisons;
- branch, team, project or service filters;
- exception and backlog views;
- supporting calculation and source tabs;
- concise refresh guidance;
- English, Arabic or bilingual presentation where scoped.
Typical pilot output
- one management dashboard page;
- one agreed source structure;
- formula-linked calculations;
- visual and formula QA;
- short user guidance;
- one revision round within the agreed scope.
How the work starts
Start with a non-confidential description of the decision, source, output and deadline. Scope, timing and fee are agreed before work starts. Do not send files or confidential data for the initial review.
Scope note
Multiple live systems, Power BI, VBA/macros, automated data connections, complex permissions and enterprise deployment are quoted separately.
Frequently asked questions
Do you sell the sample dashboard as a ready-made file?
No. The sample demonstrates design and quality. We build the client delivery around the client's data structure, KPI definitions, users, refresh process, language and visual identity.
What does the client receive?
The client receives the agreed custom Excel dashboard, supporting calculation and source structure, concise operating guidance and the revision allowance stated in the approved scope.
Are future updates free?
One revision round within the agreed pilot scope and correction of defects caused by our implementation are included. New KPIs, new pages, changed source structures, additional data sources and recurring update or analysis support are separately scoped and priced.
From discovery to delivery
- Discover the need
- Agree scope and quote
- Build within scope
- Quality assurance
- Client review
- Delivery and guidance
A bounded initial scope review
Send only the initial information below. Do not send confidential data, sensitive personal data, passwords, files or actual records. Any later material sharing is arranged through an appropriate channel after agreement.
- Contact details
- Decision to support
- Intended users
- Source type, approximate structure and row count, without actual data
- KPI needs or required cleanup rules
- Refresh frequency
- Preferred language
- Deadline
The button opens a draft in your email app; nothing is sent automatically. If your email app is not configured, write to contact@bazelglobal.com.